

Last week in our 2020 Vision series we discussed porosity and how it relates to the question:
How much oil and gas are present?
Hydrocarbon resource, often abbreviated OOIP (Original Oil In Place) or OGIP (Original Gas In Place) is the foundation for estimating how much hydrocarbon will ultimately be recovered from the ground. In many reservoirs in-place volumetric calculations are used, along with recovery factors, to create reserve reports and full field development plans.
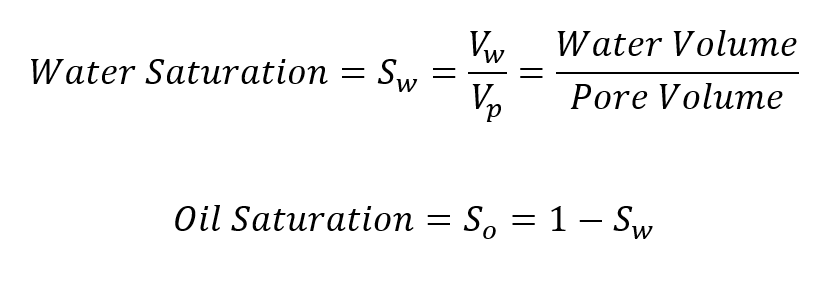
This week, we’ll continue to discuss resource assessment by taking a look at hydrocarbon saturation. After identifying the pore volume available to hold fluid, we can identify the percent of the pore volume that is oil or gas saturated. Water saturation is calculated as a percent or a decimal, and the inverse is taken as the oil (or gas) saturation.
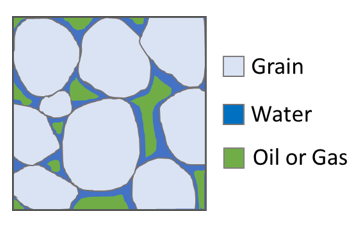
To understand saturation, imagine traveling back in time to the birthplace of a rock. For example, consider a sedimentary rock deposited in a basin. Grains are transported downslope from carbonate rims and adjacent highlands. Organic matter from decaying plants and animals also drift to the basin floor. As the basin fills, the grains and organics are covered with an increasing load of sediment above, causing the grains to compact. Originally, the water saturation between the grains is 100%. As the grains are compacted and the rock becomes lithified, the pore space is diminished and some of the water is expelled. With the right amount of temperature and pressure, the organics are converted to kerogen, and eventually petroleum. The conversion of organics into the liquid phase increases the pressure in the rock and often induces fractures. Hydrocarbons escape (or migrate) to lower pressure reservoirs and displace some of the water in the rocks. Accumulations of hydrocarbon require a certain oil saturation in order for oil to flow economically. Understanding oil saturation variations is critical to the development of successful wells. Oil saturation cutoffs (economic thresholds) are dependent on wettability (whether oil, water, or gas adheres most strongly to the surface grains) and relative permeability (the flow preference of oil, gas, or water).
Saturation is usually mathematically modeled from an array of downhole logging tools. Resistivity is one of the key tools, because water and oil typically have a distinct resistivity response. We avoid swimming in electrical storms because water is conductive (or low resistivity). Oil and gas are not very conductive, having much higher resistivity. Saturation modeling is dependent upon the understanding of facies and porosity. There are also laboratory methods to measure saturation from core data, and logging models should be tied to core where possible.
Now that we have described pore volume and hydrocarbon saturation, we have defined the space available for hydrocarbons within the reservoir, a key component of resource assessment.

Recent Comments